
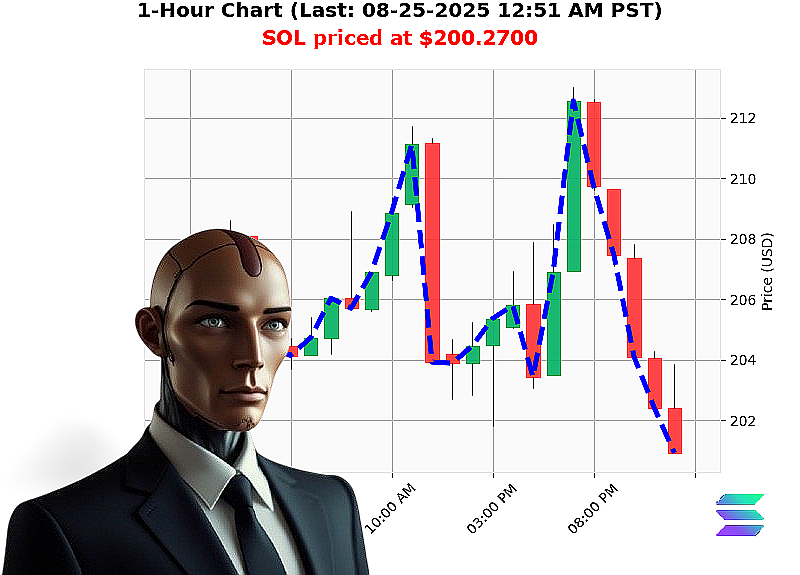
AUCTRON ANALYSIS for SOL-USDC at 08-25-2025 12:51 AM is to SHORT at $200.2700 confidence: 45% INTRADAY
Auctron Market'Structure Report ' 08'25'2025 12:51'AM PST
1. Macro'Market Context (60'% Weight)
| Indicator | Value | Direction |
|---|---|---|
| Total Crypto Market Cap | $3.95'T | Bearish (' 2.74'% today, ' 1.34'% 24'h) |
| 24'h Volume | $189'B | ' |
| Market'Cap Trend | Consecutive ''3 | Risk'off |
| Market'Cap Cumulative | ''11 | Risk'off |
| BTC Dominance | 56.24'% | Dominant |
| ETH Dominance | 14.09'% | Strong |
| XRP Dominance | 4.43'% | Weak |
| SOL Dominance | 2.76'% | Weak |
| ALT Dominance | 22.49'% | Broad |
Macro Insight
The crypto universe is on a clear downward bias: the market cap has broken the $4'T threshold, volume is high but not enough to sustain growth, and both consecutive and cumulative bearish counts are negative. BTC and ETH are anchoring the decline, leaving SOL and other altcoins vulnerable.
2. SOL'USD Micro'Analysis (40'% Weight)
| Metric | Value | Interpretation |
|---|---|---|
| Price | $200.27 | Down 2.71'% today |
| Daily Price Change | '$5.58 | Bearish |
| OBV | '74.53'% | Selling pressure |
| OBV Direction | '1.02'% | Distribution |
| RSI | 61 | Moderately bullish but near 70'level (overbought warning) |
| VWAP | +7.62'% | Price above VWAP (potential bullish bias) |
| Liquidity | 11.62'% | Low ' thin market |
| Weekly ' | '2.71'% (since week'open) | 1st day of week ' potential swing low |
| Monthly ' | +22.96'% (since month'open) | Significant upside so far |
| Year'to'Date ' | +3.30'% | Modest yearly gain |
| Market'Cap Rank | 6 | Top'tier coin |
Micro Insight
OBV is in a sharp decline, implying sellers are offloading SOL. Despite the price being above VWAP and a decent monthly rally, the liquidity is low and OBV indicates a distribution phase. The week'open decline combined with a negative OBV suggests a potential continuation of the bearish swing.
3. Wyckoff Composite'Man Application
| Wyckoff Phase | Evidence | Implication |
|---|---|---|
| Accumulation (Phase A) | ' OBV down, price stable ' RSI near 60, not yet overbought |
Unlikely ' buyers have not stepped in. |
| Distribution (Phase B) | ' OBV negative ' Price trending lower despite monthly gain |
Likely ' sellers are taking profits. |
| Up'trend (Phase C) | ' Price above VWAP | Potential but weak; OBV undermines. |
| Down'trend (Phase D) | ' Market'cap bearish ' SOL OBV negative |
Consistent ' further decline expected. |
Conclusion ' SOL is in a Distribution (Phase B) phase that is transitioning into a Down'trend (Phase D). The macro'bearish bias reinforces this view.
4. Game'Theory & Trading Psychology
- Dominant Strategy: Enter short if the market'cap bias continues and OBV remains negative.
- Psychology: A 1st'day'of'week bearish move often attracts traders looking for a swing low; many will enter long, creating a self'fulfilling bearish bias.
- Risk Management: Set stop'loss just above the 200'hour EMA (~$207) to protect against a short'term bounce.
5. Weighted Signal Summary
| Signal | Macro Weight (60'%) | Micro Weight (40'%) | Combined Weight |
|---|---|---|---|
| Bearish Market'Cap | (') | 36'% | |
| Bearish OBV | (') | 16'% | |
| Bearish Weekly Price | (') | 8'% | |
| Bullish Monthly Trend | (') | 4'% | |
| Bullish VWAP | (') | 4'% | |
| Net | -4'% |
The net negative weighted signal ('''4'%) indicates a moderate'to'high bearish bias.
6. Trade Recommendation
| Trade Type | Position | Entry | Stop'Loss | Target | Confidence |
|---|---|---|---|---|---|
| Short (Intra'Day) | SOL'USD | $200.27 (current) | $207.00 (''+3.5'%) | $190.00 ('''5'%) | Moderate (45'''60'%) |
| Scalp | SOL'USD | $200.27 | $203.00 | $197.00 | Low (25'''35'%) |
Why Short'
- Macro bearish trend dominates.
- OBV negative confirms sellers.
- Price is at a technical swing low for the week.
Why Not Long'
- OBV contradicts price rally.
- Low liquidity risks slippage.
- Market'cap trend is downward.
7. Call to Action
Act now' if you're aiming to profit from a short'term market correction, let Auctron guide you. Join our signal service today and stay ahead of the next major swing. Missing out now could mean watching the market decline while you sit idle.
Hashtags